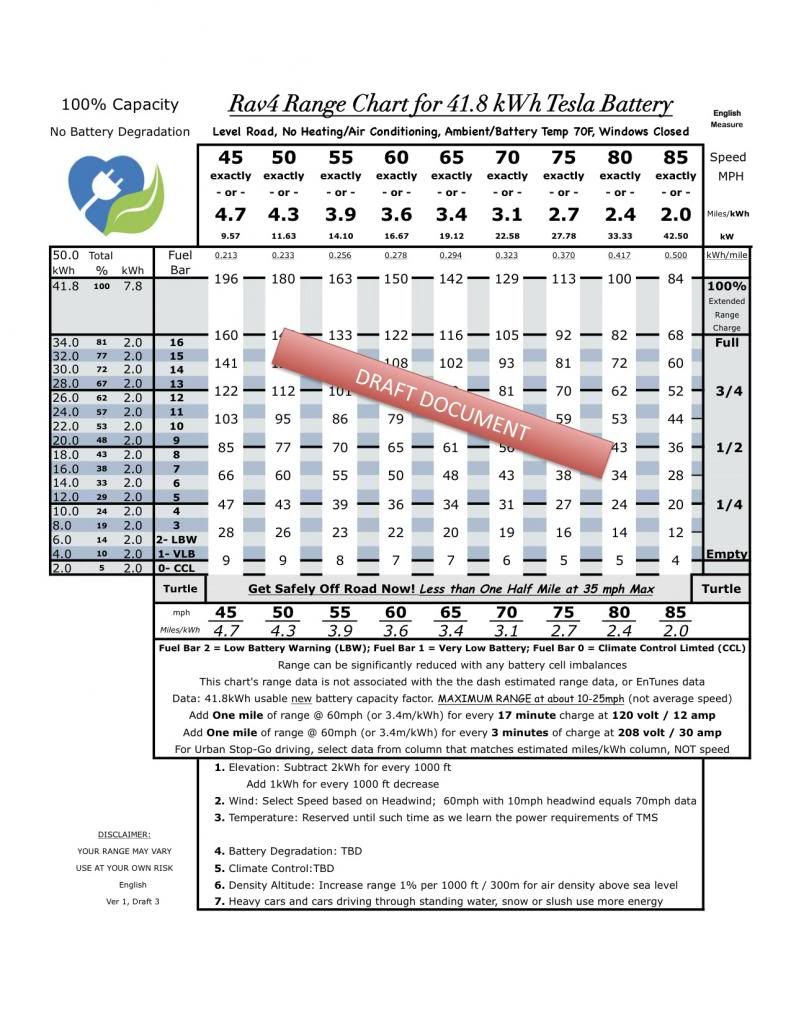
Tony, the only thing we don't know for absolute certain, without speculating, is the "actual" full energy storage battery capacity. Although, we have been able to estimate it from the energy it takes to do a full "extended" charge, which as you know turns out to be close to 50kWh. This is reflected at the top of the left hand column in your range chart. Also, we don't know if what appears to be ~8kWh of "extra" (unusable) charge is stored at the top or only at the bottom, or some combination. I suspect the latter. Anyways, thanks for your work on the range chart estimator as it promises to be a very useful reference guide.
A few suggestions . . .
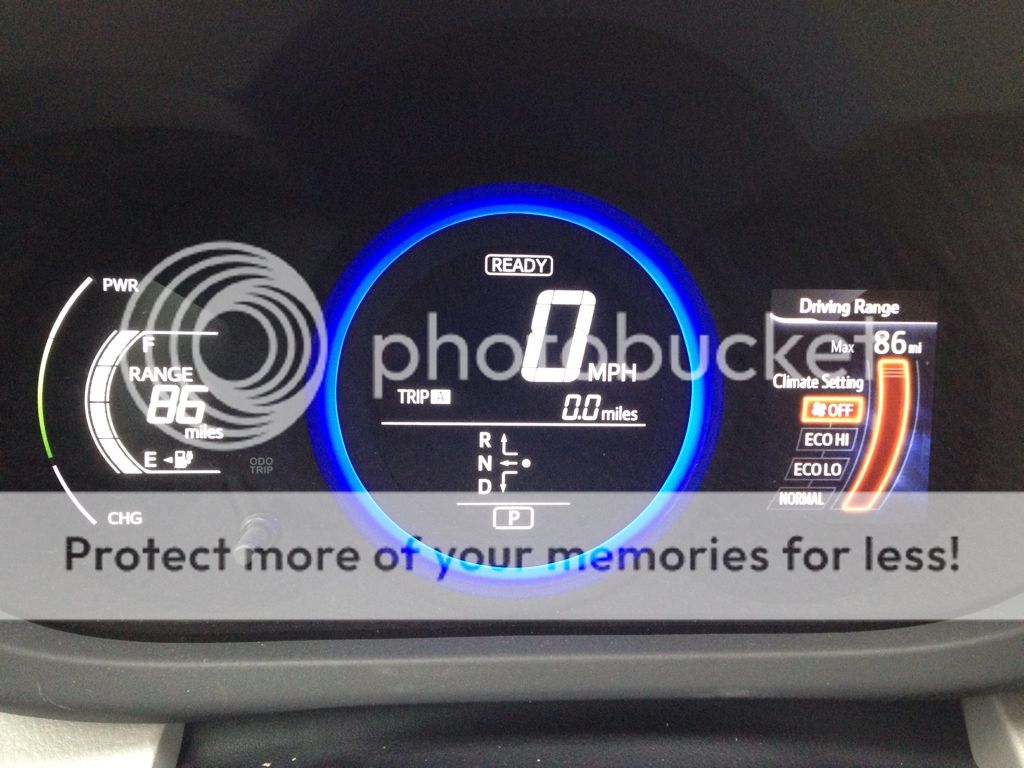
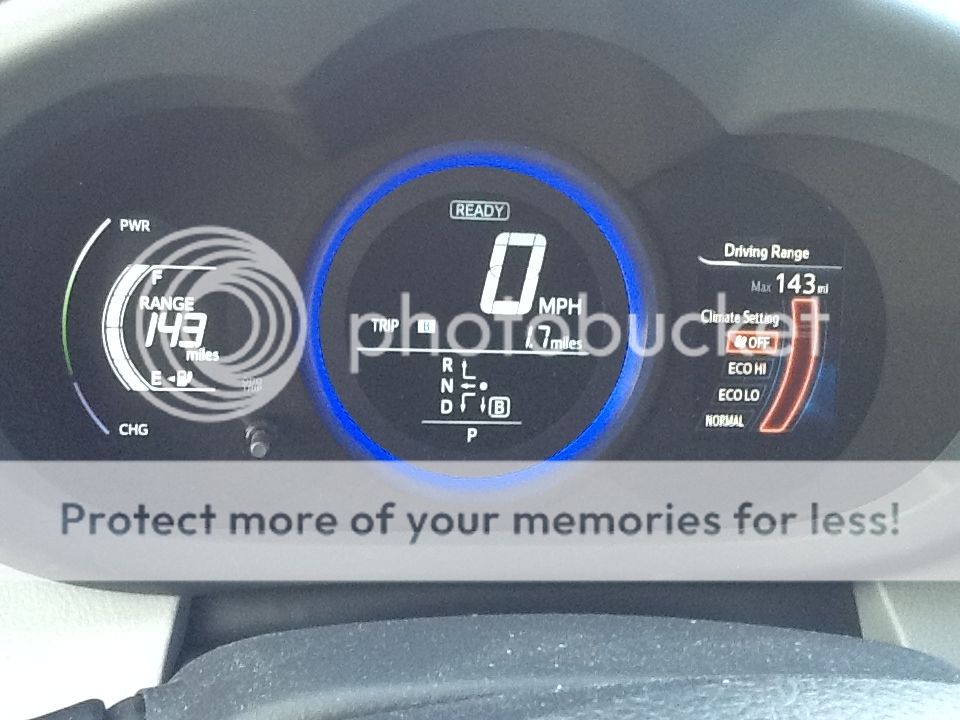
1. Shade the column that corresponds to Toyota's "official" estimated range of 92 miles at 80% charge, and 113 miles at 100% charge, just to give users a sense of how much better (or worse) ranges will or can be depending on "how they drive". This also is the column that correlates to the EPA range estimate on the window sticker.
2. Add in additional rows of range numbers, so there is a 1:1 relationship for each value on the far left hand column. As it is now, interpolation is necessary which should be eliminated.
3. Add a footnote to explain that the the top of the chart reflects the difference between a full extended charge (highest row) vs. a fully standard charge (next to highest row).
4. Add another footnote to explain that after a fully extended charge, the first segment to extinquish on the battery range gauge represents a battery depletion of ~9.8kWh (actually, 7.8kWh of hidden charge + 2.0kWh after 1st segment used up). This corresponds to ~20% of total battery energy depletion from an absolute maximum, 100% SOC (~50kWh), or effectively ~23.4% of USABLE battery capacity (41.8kWh). Obviously, this is a disportionately larger drop/seqment than reflected in all other lower 15 segments. This is because the battery continues to deplete fairly linearly at a rate of ~2kWh (or 6%) per segment to use up the rest of its usable energy. When the last segment extinquishes, there is less than ~2kWh of further (hidden) charge depletion (perhaps only 1 or 2%, or even as little as a couple 100Wh, depending on battery condition) of usable capacity allowed before Turtle mode activates.
This might be too much information, and perhaps too much "guesswork", but I think a better interpretation of the left hand columns on the chart.