


miimura
Well-known member
I was looking at my EV Past Record screen and found it to be useless because all the bars are the same height. My driving is not THAT consistent. I was hoping that the January bar would reflect the colder weather lowering the efficiency with heater use. Are others seeing this?
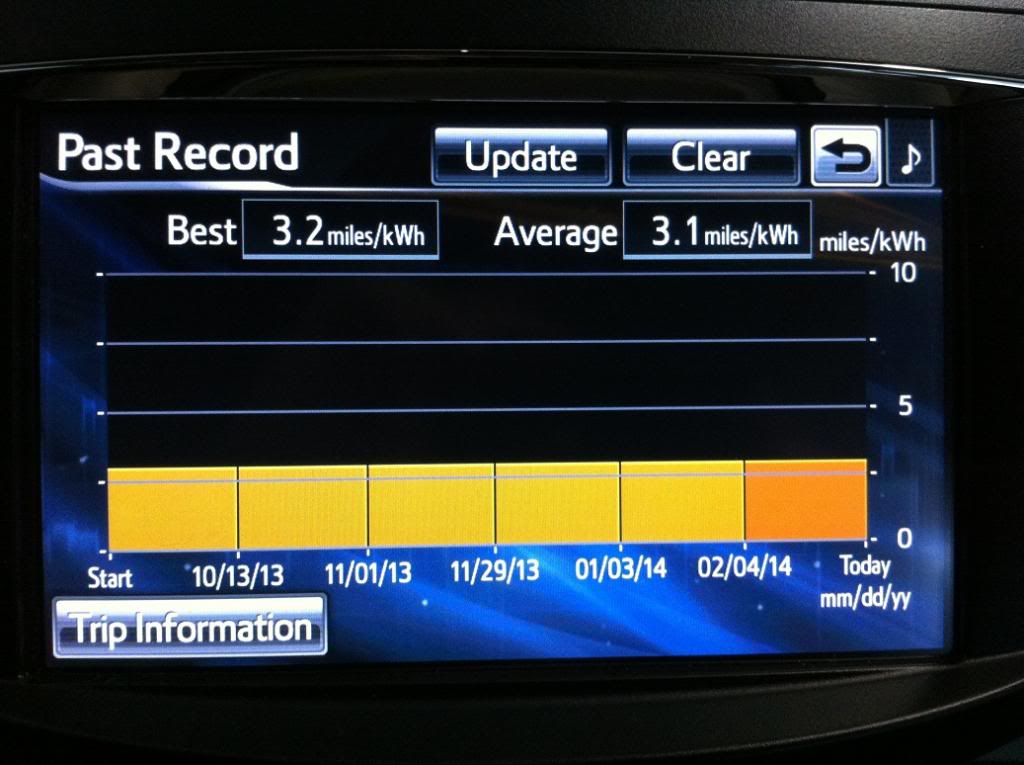
I did an "Update" yesterday to start a new bar on the chart and just after reset, it jumps around a lot. Between at least 2.7 and 3.2 mi/kWh, the bar was the same height. Also, it doesn't show the actual value of each bar with a number. So, the only useful information is the average value for the current bar at the upper right. Is the engineer in me being too picky about this?
I understand why the dashboard screens should not have a lot of small numbers to read because they would be a distraction while driving, but this is relatively deep in a menu on the NAV screen where they should be able to present a little more detailed information.