asavage said:
Alternatively, one can "purchase" the Tesla Powertrain Diagnostic software -- cracked -- and set it up in a dedicated OS install, then put together a cable that plugs into the Tesla Gateway box at the LR of the vehicle, and which has a RJ45 connector on the other end, plug that into a Ethernet<->USB adapter.
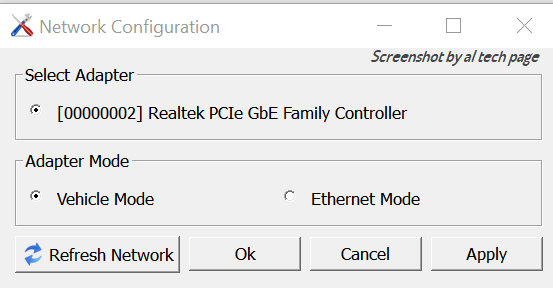
As I suspected, the Ethernet<->USB adapter is not necessary, if the host computer has its own Ethernet port. The laptop I use for auto diagnostics has a 8P8C/RJ45 LAN port, and I have TPD working with my RAV4 EV using that port, no USB involved.
alflash said:
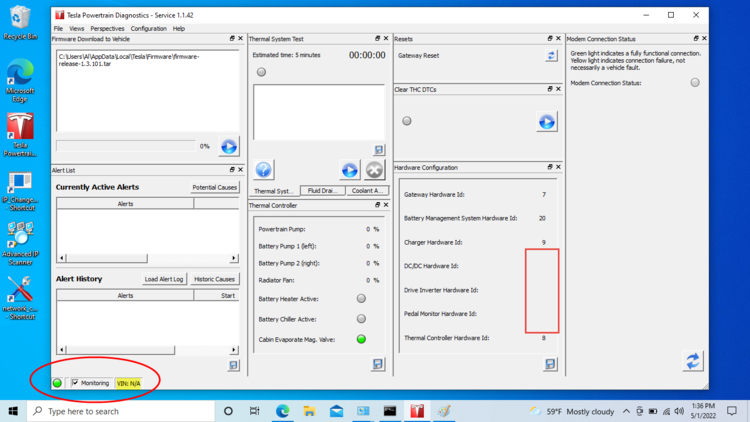
Notes. When diagnosing RAV4EV, the modem connection status is always yellow. I have never seen green.
When the indicator on the lower left (next to the "Monitoring" checkbox) is green, the Modem panel can be refreshed via its "recycle" button at the lower right of its panel, and then (on my vehicle) the modem indicator in TPD turns to green. I assume that when 3G goes away in the US later this year, that will cease to turn green.
alflash said:
NOTE: If all steps have been completed and the status light* on the Tesla Powertrain Diagnostics RAV4 - Service software is still red, this is potentially a local firewall issue.
*
[/quote]
Good guess, Vlad.
With computers, it's hard to be certain, but I think the Windows Firewall was my issue. It's probably one of those non-intuitive things.
I had gotten fed-up with my lack of progress in getting TPD working; it would not communicate with the Gateway, yet a port scanner could find the Gateway's MAC and and IP of 192.168.90.102, so I was convinced the hardware connection was OK. I set that project aside for a month, and came back to it today.
My auto diagnostic laptop boots several OSs, and I keep each setup maintained separately. When I went to boot my TPD OS today, something seemed odd but I couldn't put my finger on what, until I went to check the hardware LAN port's IP address: I then realized that rather that Win 8.1, it had automatically upgraded to W10, and it had done so more than ten days ago, so no easy way to revert. Damn!
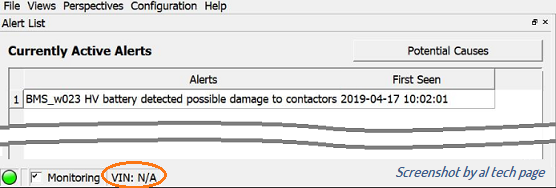
Well, poking and prodding, eventually TPD did give me a green "light" at the lower left, but but some fields were unpopulated, and when attempting to DO something, I'd see a popup warning about being unable to load data, even with a green light, and I'd never seen the VIN field populated.

But, Hey! That green light had never happened here before, so I was counting that as progress.
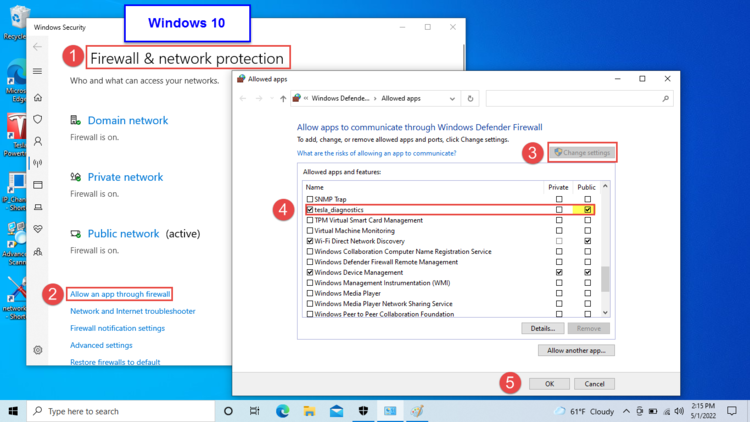
Eventually, I re-checked the Windows Firewall, and found that TPD was set to allow data for Private networks (eg, my built-in Ethernet port) but not Public networks (eg the laptop's Wi-Fi). Which seemed correct to me, but I do not trust my guesses when it comes to UIs, so I added "Public" networks as a firewall exception, and TPD now works. In fact, I turned off "Private" networks access, and it's still working.
I've no idea why, but my un-egged beer is more than satisfactory

I tried various firewall options, and landed on this:

I note that TPD takes a while to get to the diagnostic panels screen, maybe 10-15 seconds, and that -- annoyingly -- the program does not provide feedback that a further 10 seconds is needed to begin to communicate with the Gateway. Gawd, I hate UIs that do not provide a live throbber or equivalent, to let you know that something is happening and to wait.
hokiematt said:
You may need to uncheck and check the checkbox in the lower left of the screen next to 'Monitoring' to establish communications. The red status light should turn green, and the box next to 'Monitoring' should be populated with the vehicle VIN.
So far (sample size: 6 runs) I haven't had to touch the Monitoring checkbox; every time, given a sufficient startup time, it's turned green.






![Car Charger Adapter - [Upgraded Version] Car Fast Charger with 4 Ports (PD+QC3.0+USB C) Atmosphere Light - 12-24V Car Truck SUV Universal USB Cigarette Lighter Adapter(QC3.0+PD+2.4A+2.4A)](https://m.media-amazon.com/images/I/41TzjUqcNaL._SL500_.jpg)


